PLATFORM
CLDigital BI

Data for Everyone
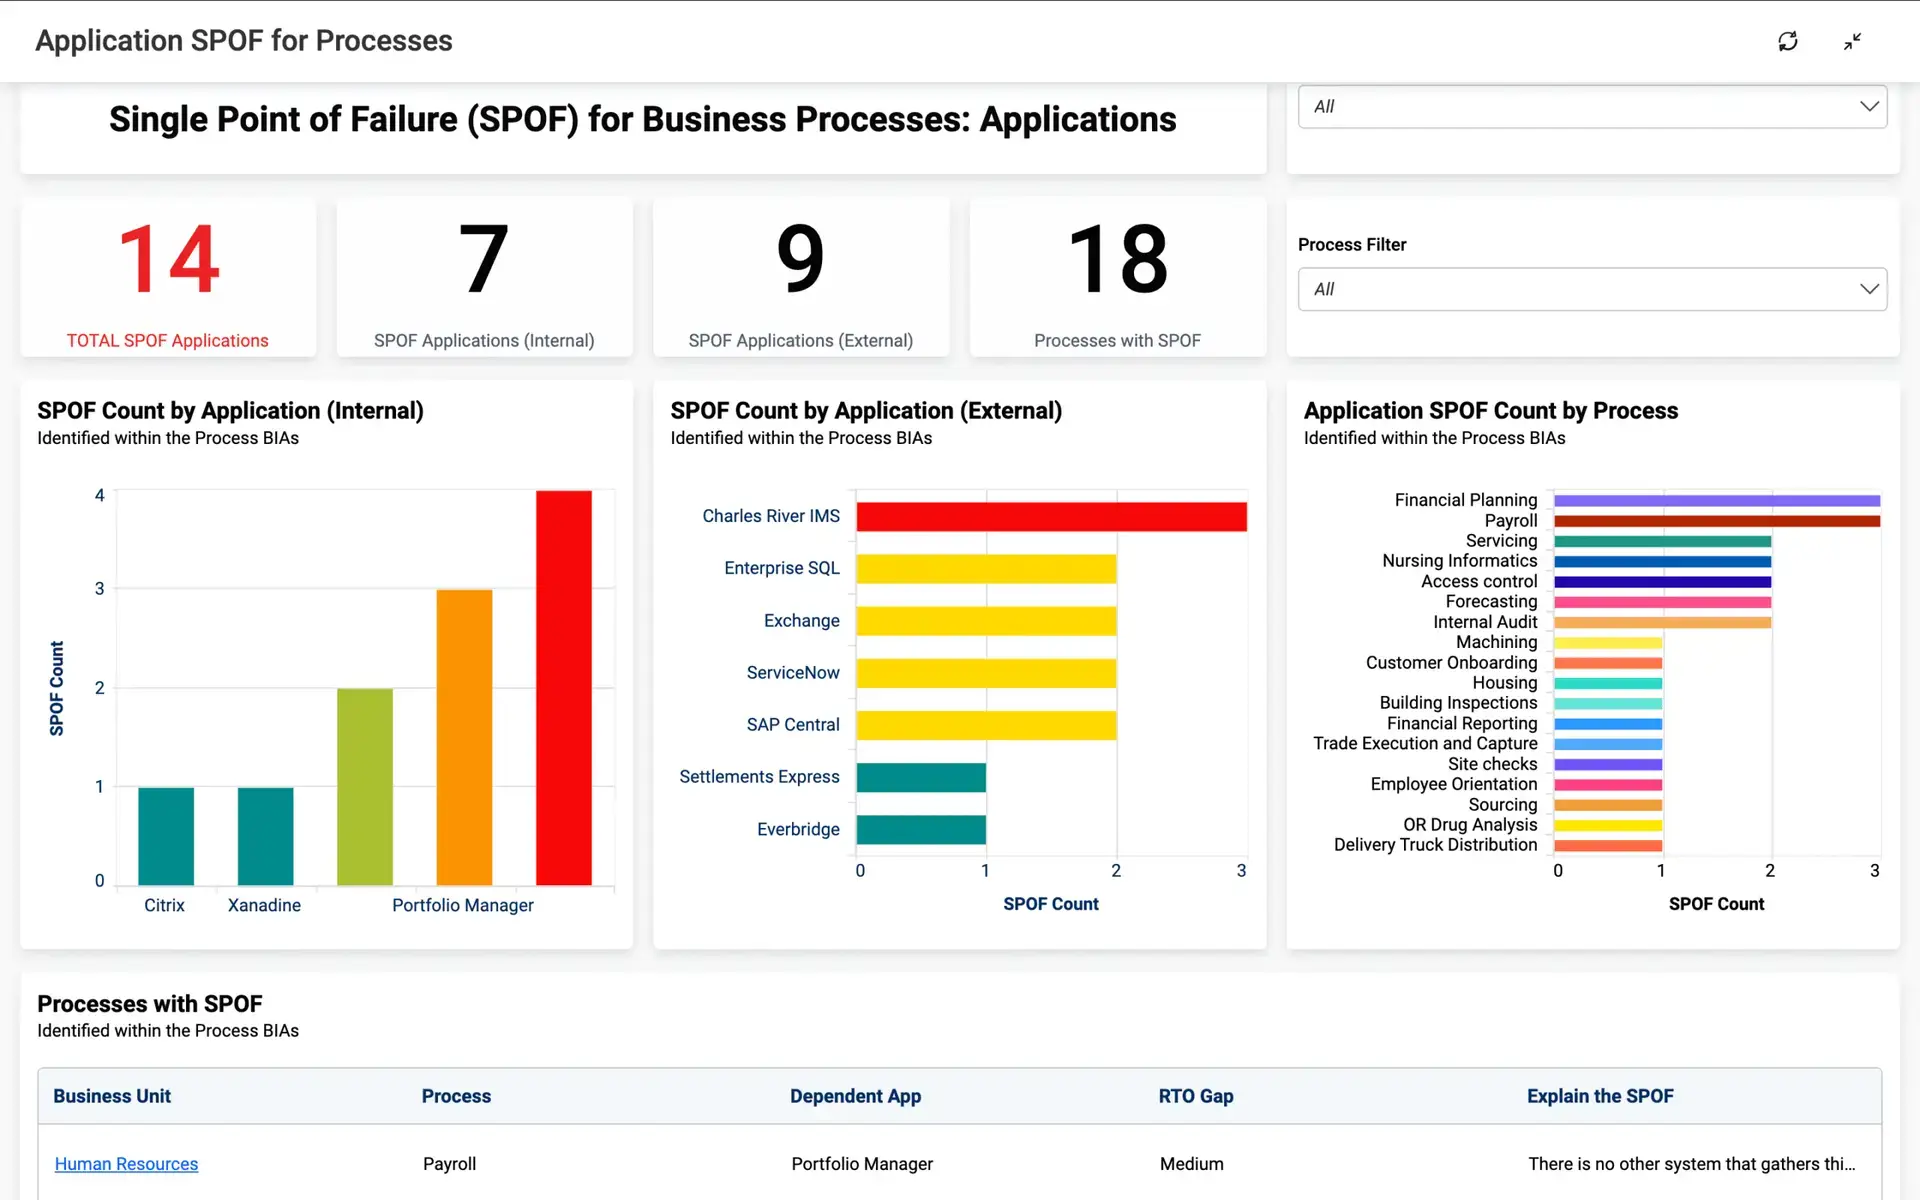
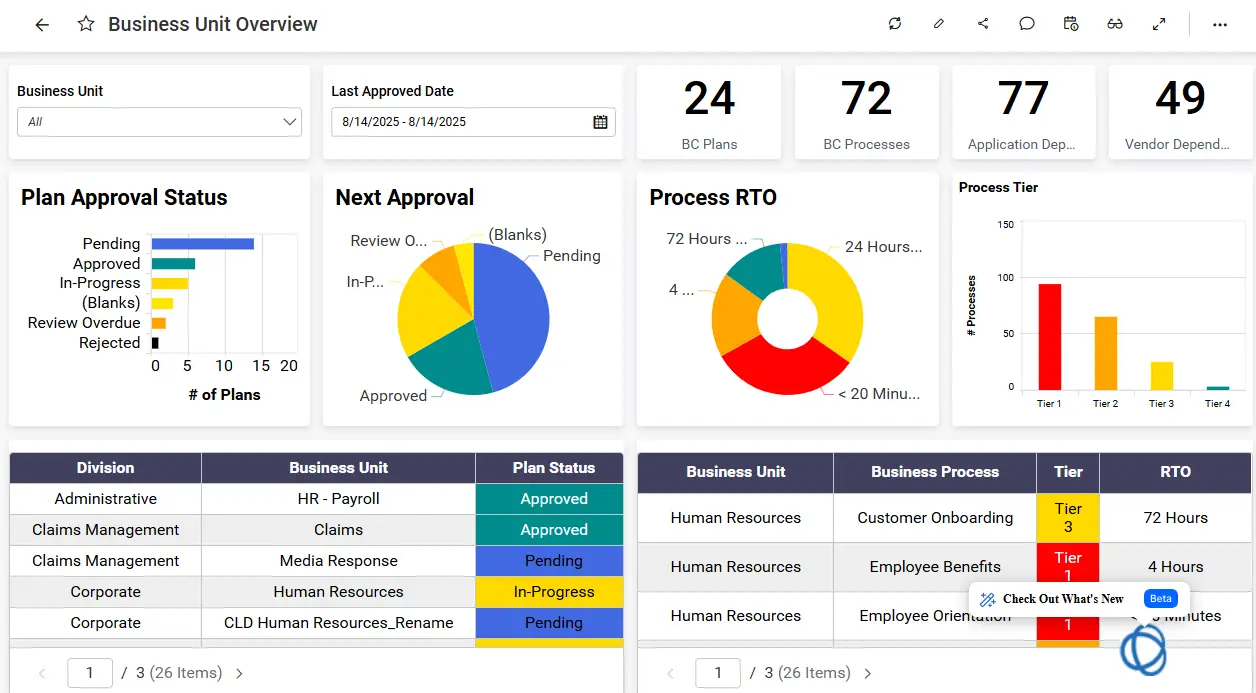
Custom dashboards and self-service analytics make insights accessible across the enterprise, allowing you to monitor key performance indicators, track trends, and gain actionable intelligence with ease.
$200M Revenue Company
“Our business is global and changes daily. The ability to easily move plans and folders within CLDigital with no coding saves us a ton of time every year.”
Chief Information Officer
- Large Insurance Company
- United Kingdom
$200M Revenue Company
“Our business is global and changes daily. The ability to easily move plans and folders within CLDigital with no coding saves us a ton of time every year.”
Chief Information Officer
- Large Insurance Company
- United Kingdom
Instant Decision-Making
Empower decision-making across the organization.
CLDigital BI removes reliance on IT teams by giving every user access to the analytics they need, enabling faster, more confident decisions.

BENEFITS
Custom Dashboards
User-Friendly Analytics
Faster Insights
Data-Driven Decisions
Make better decisions at every level
FAQ
Platform FAQs
Do I need technical skills to build or modify dashboards?
Can I report on any data within CLDigital 360?
Can dashboards be personalized or filtered by user role?
How fast is it to create dashboards or reports?
Can I export or share dashboards and reports?
How often is the data refreshed in CLDigital BI dashboards?
GET STARTED
Let's Connect
Discover how our platform can help you achieve better outcomes and you prepare for what’s next in risk and resilience.